Press Release: CloudAhoy 6.0 – CFI Assistant Provide Automatic Scoring

September 24, 2019
FOR IMMEDIATE RELEASE

CloudAhoy 6.0 – CFI Assistant Provide Automatic Scoring

CloudAhoy introduces a Pro version

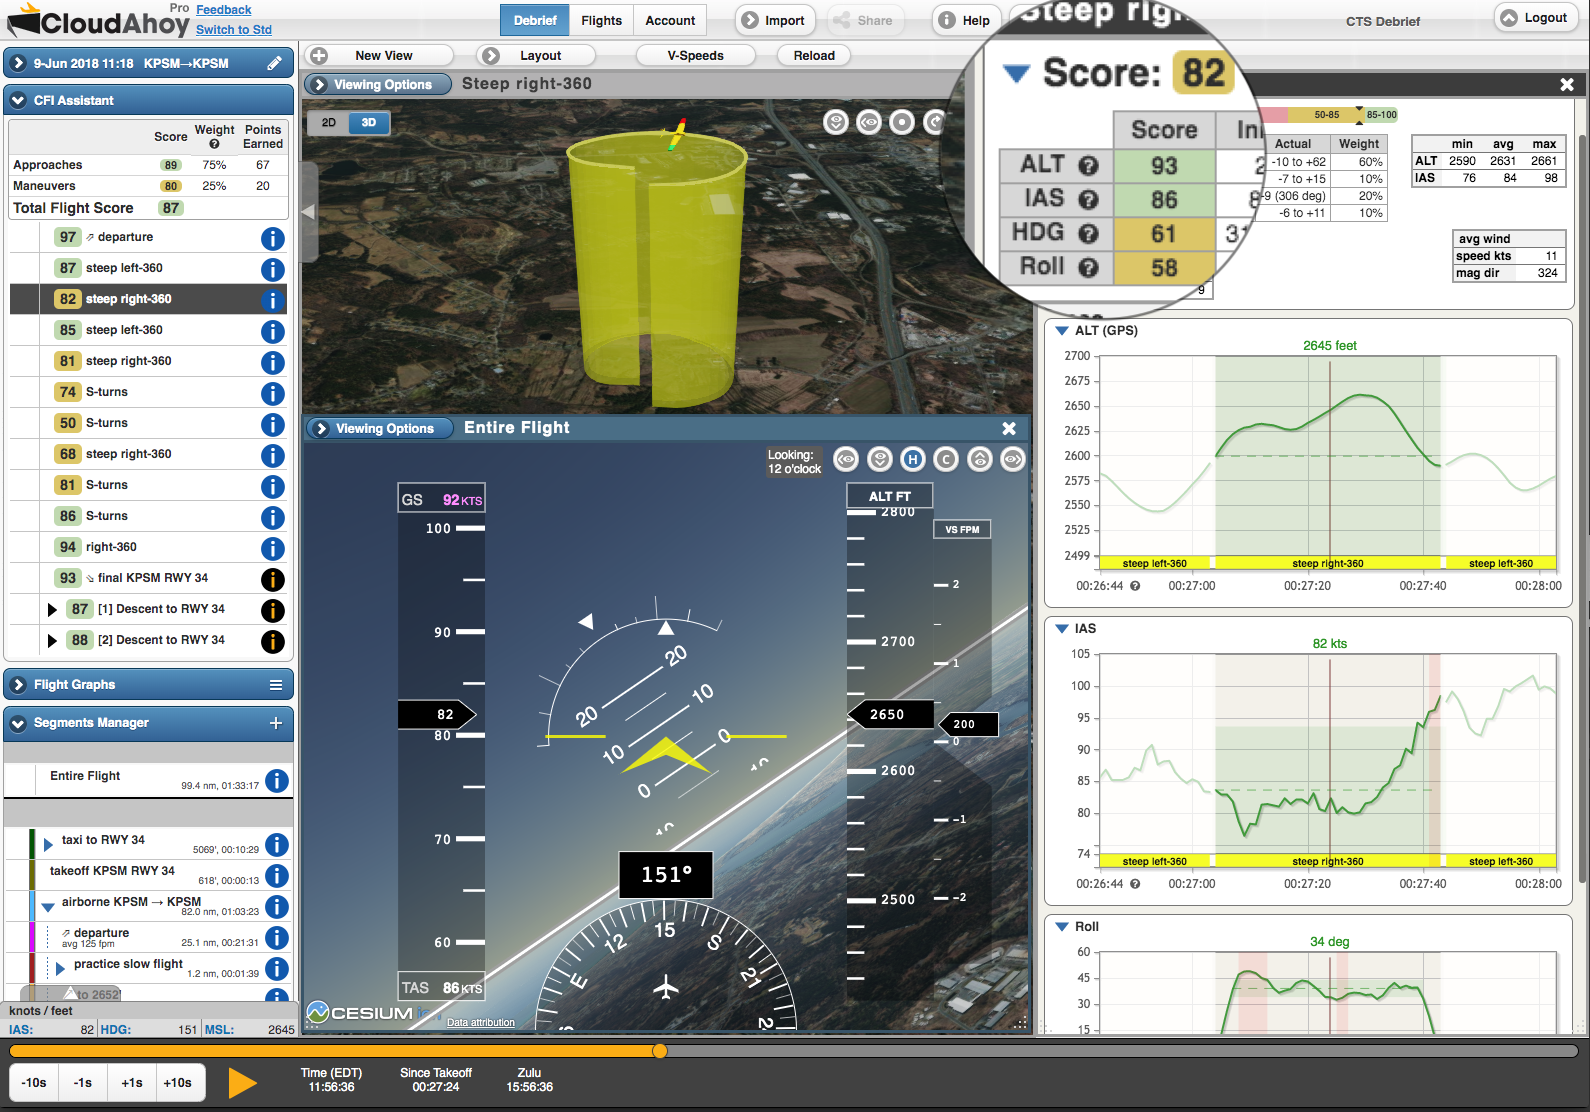
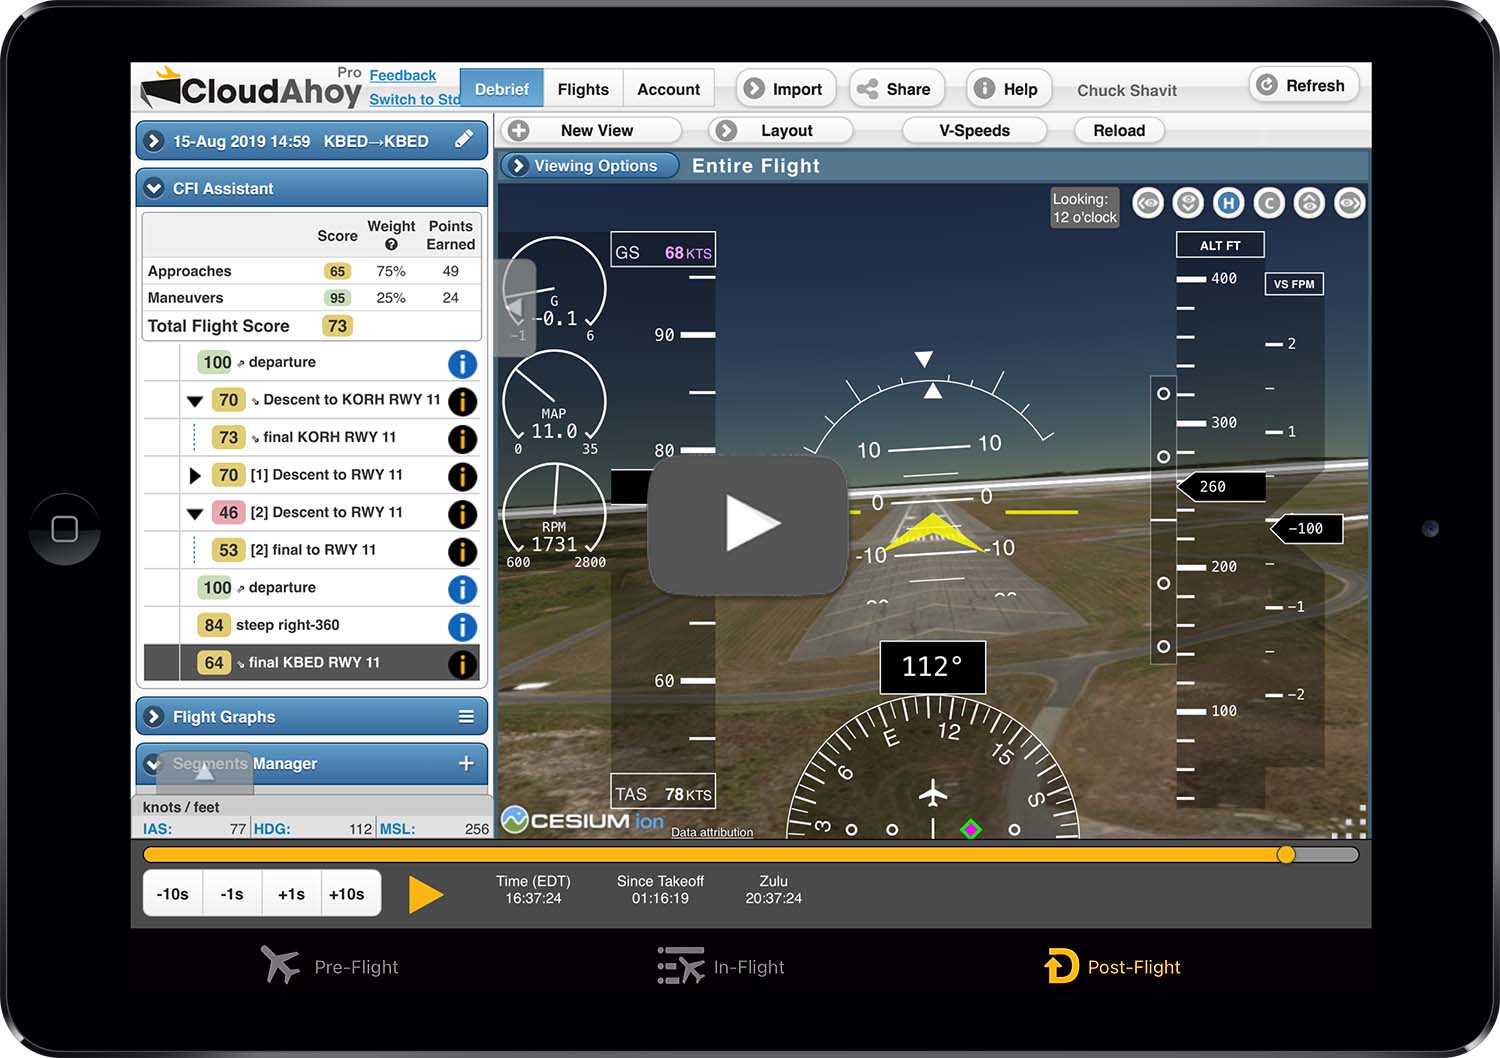
Lexington, MA (September 24, 2019) — CloudAhoy announces the release of CFI Assistant, for automatic scoring of pilot performance. The CFI Assistant is included in CloudAhoy Pro, along with additional advanced features for post-flight debriefing. It is released as part CloudAhoy 6.0 which has numerous new capabilities and enhancements.

“Automatic scoring of pilots’ performance has been in our vision since the very beginning of CloudAhoy.  We believe that data-driven, objective, automated scoring of a pilot’s performance provides valuable feedback to any pilot at any level, for flight training and for proficiency of experienced pilots.” says Chuck Shavit, the founder and CEO of CloudAhoy. “The CFI Assistant certainly does not replace a human flight instructor – flight instructors are indispensable – but specific aspects of pilot performance and proficiency are objective and measurable, and that’s where the CFI Assistant comes in.”

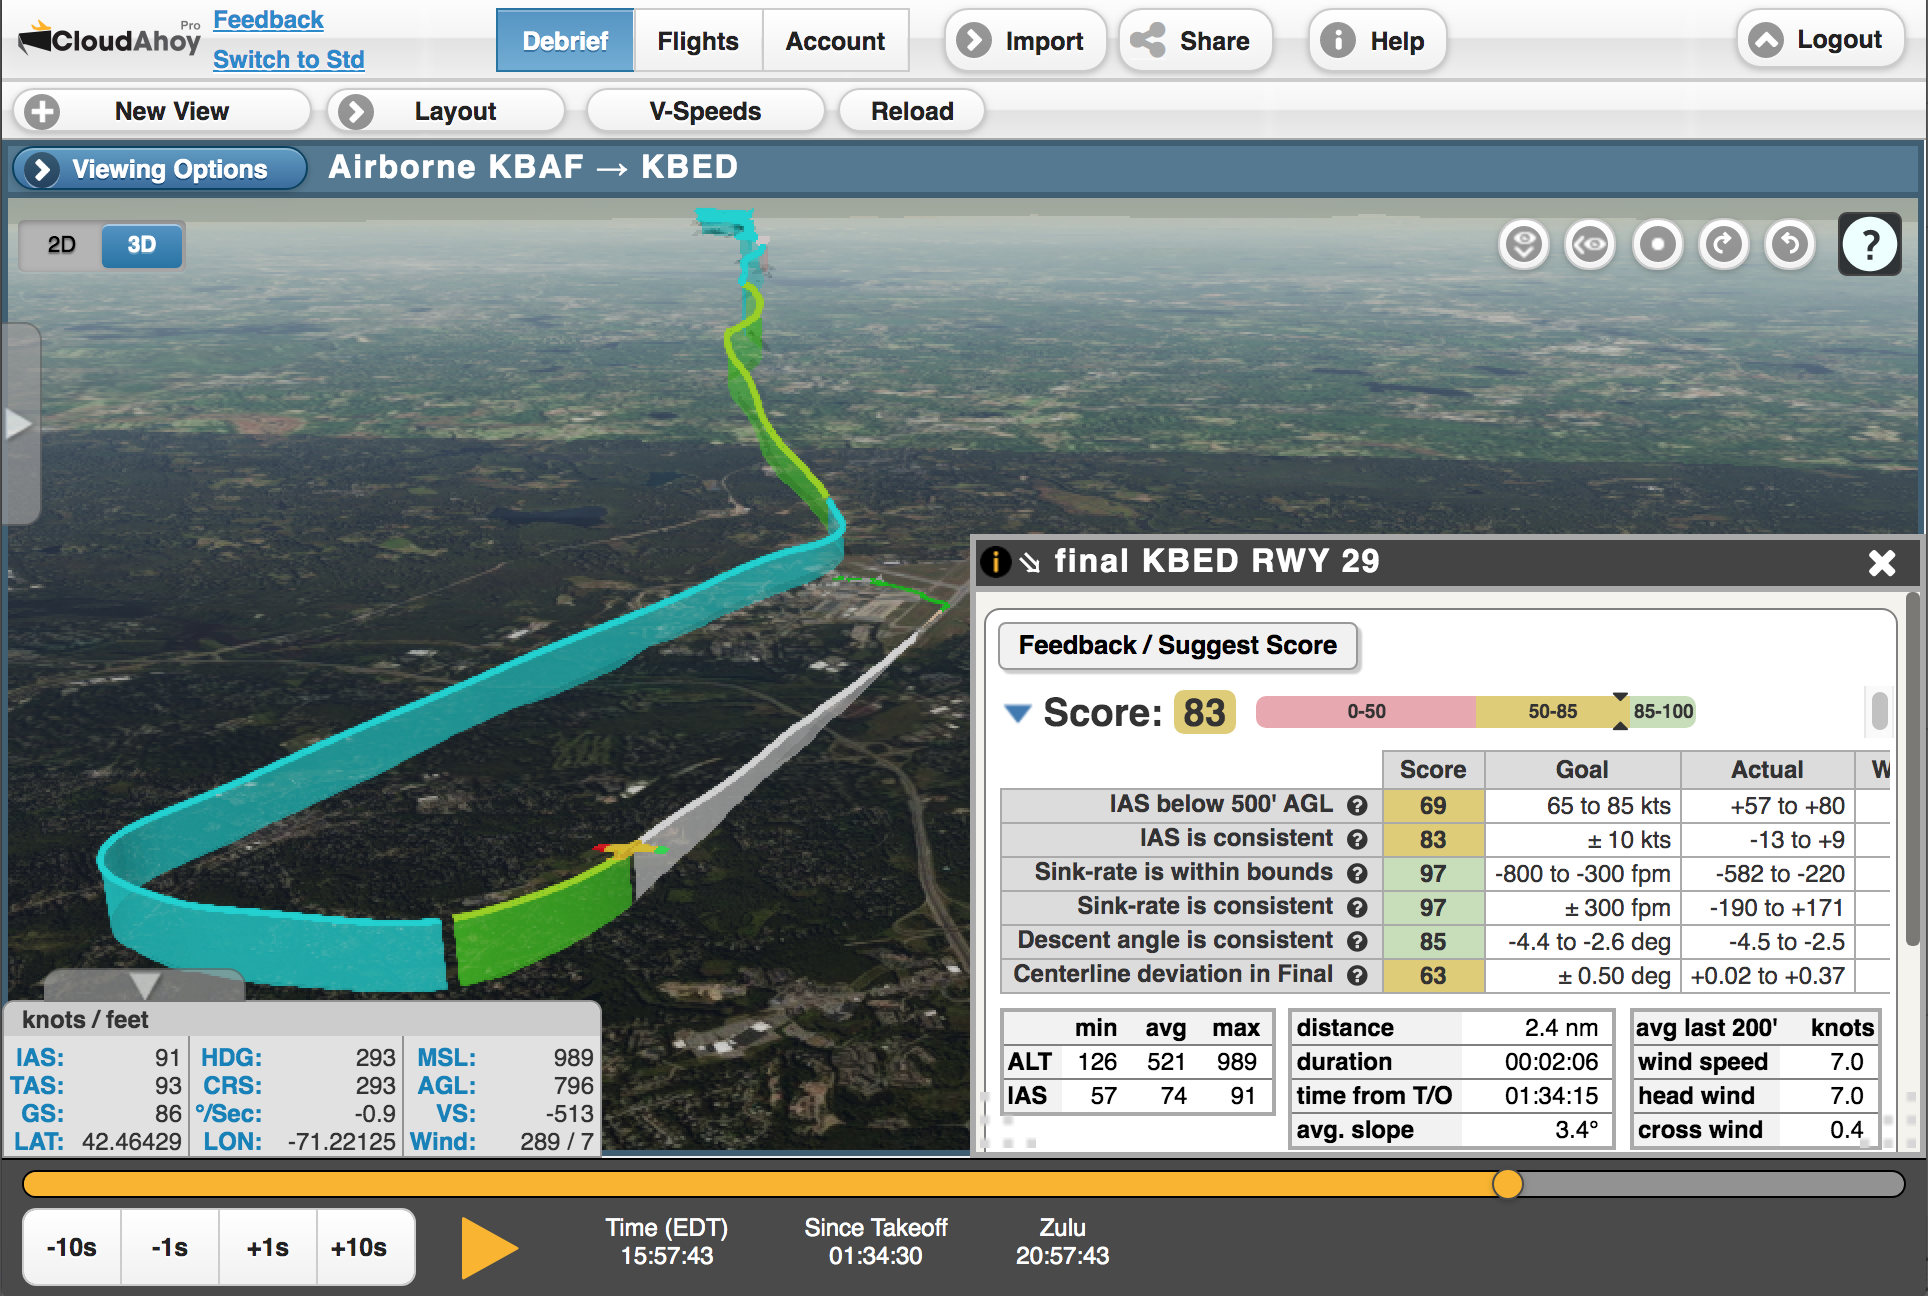
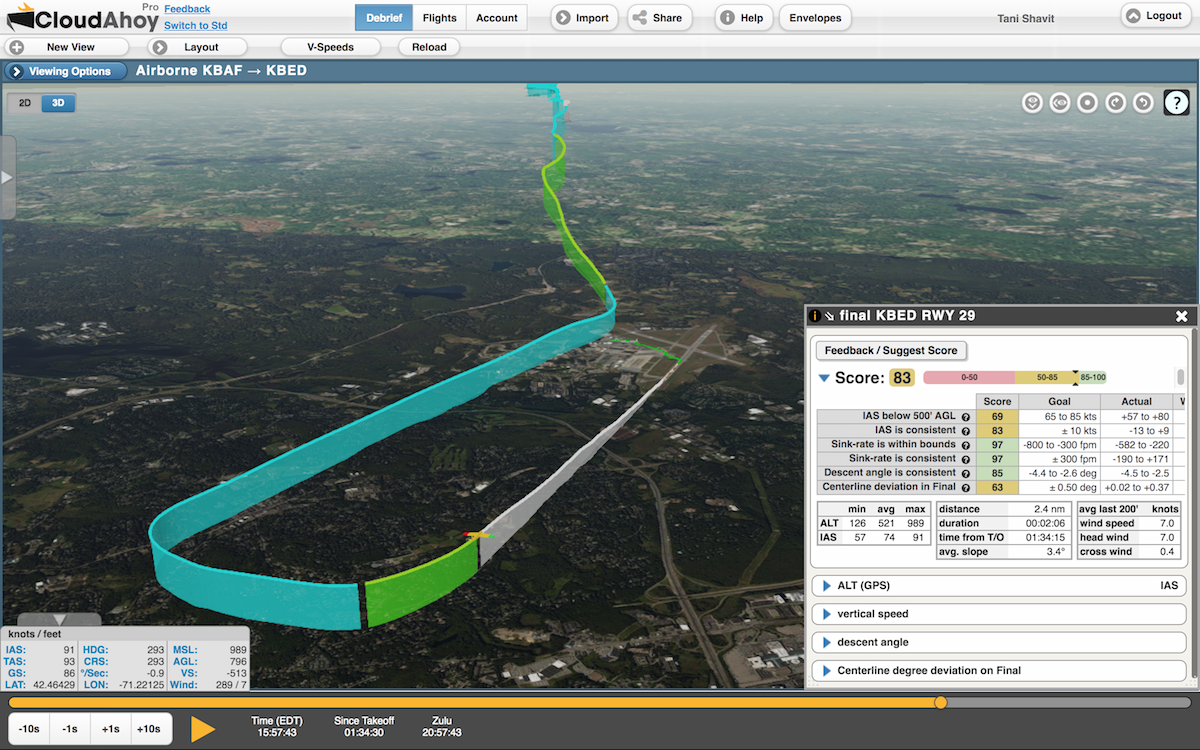
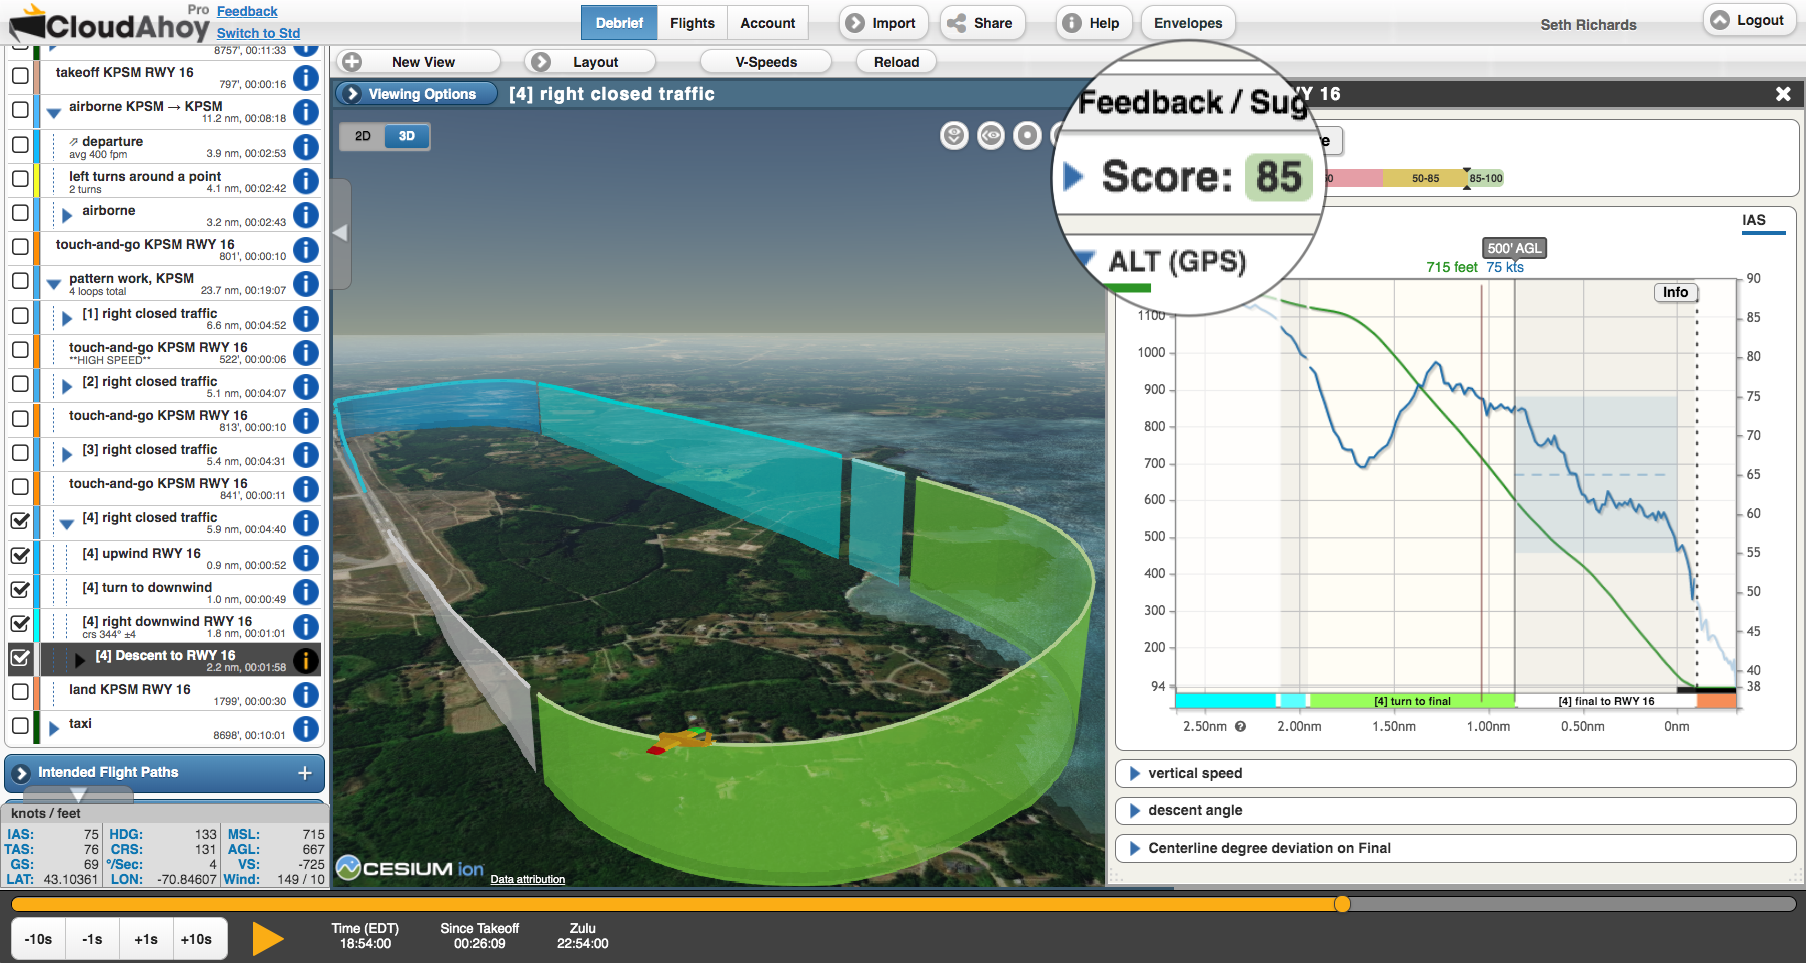
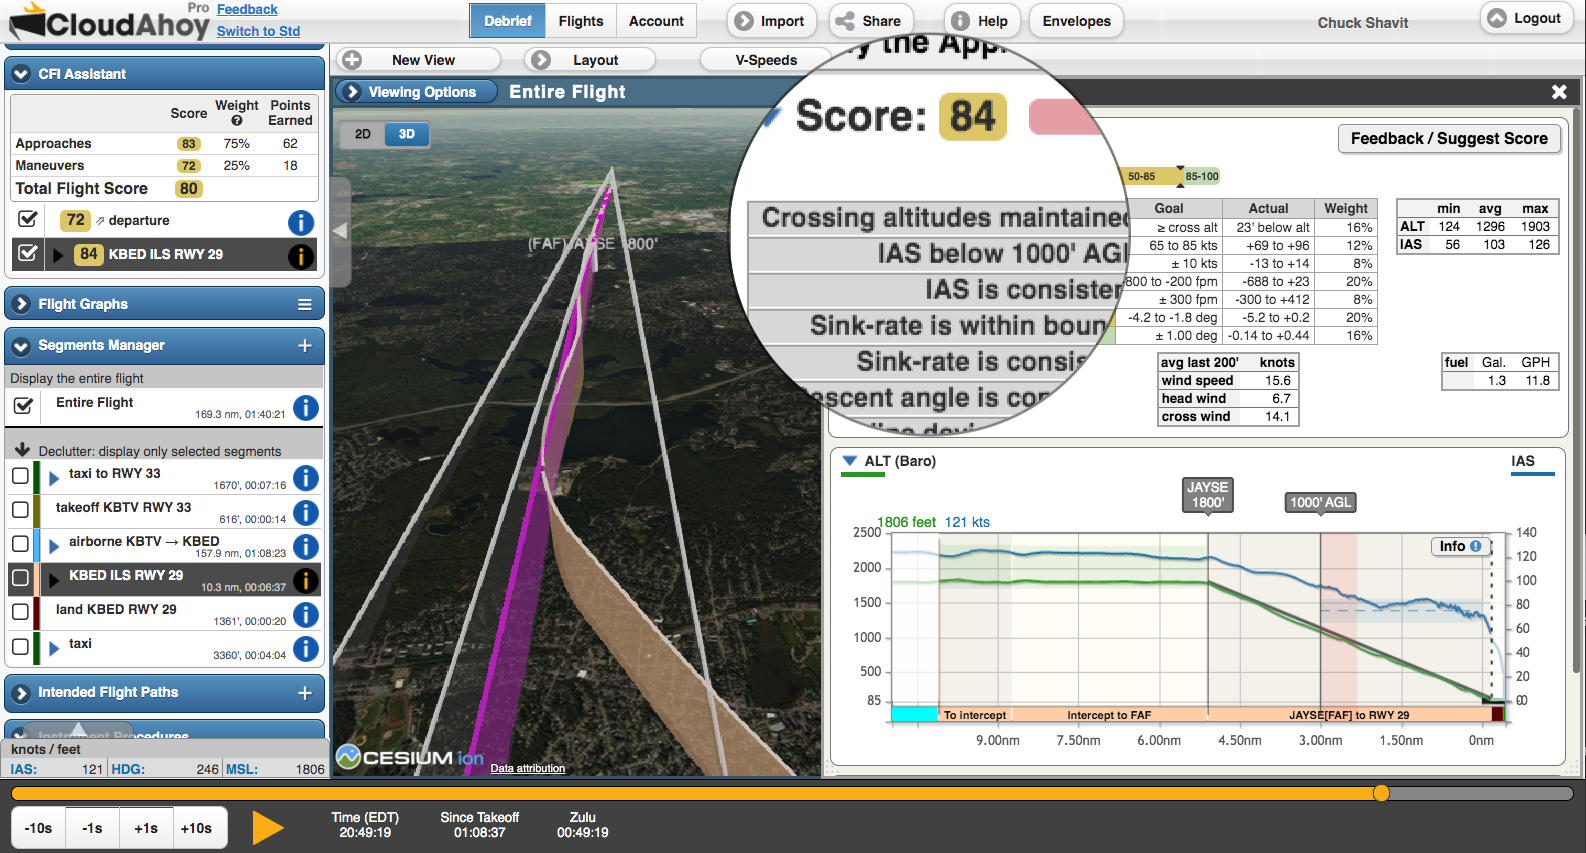
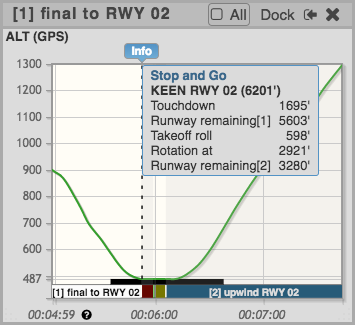
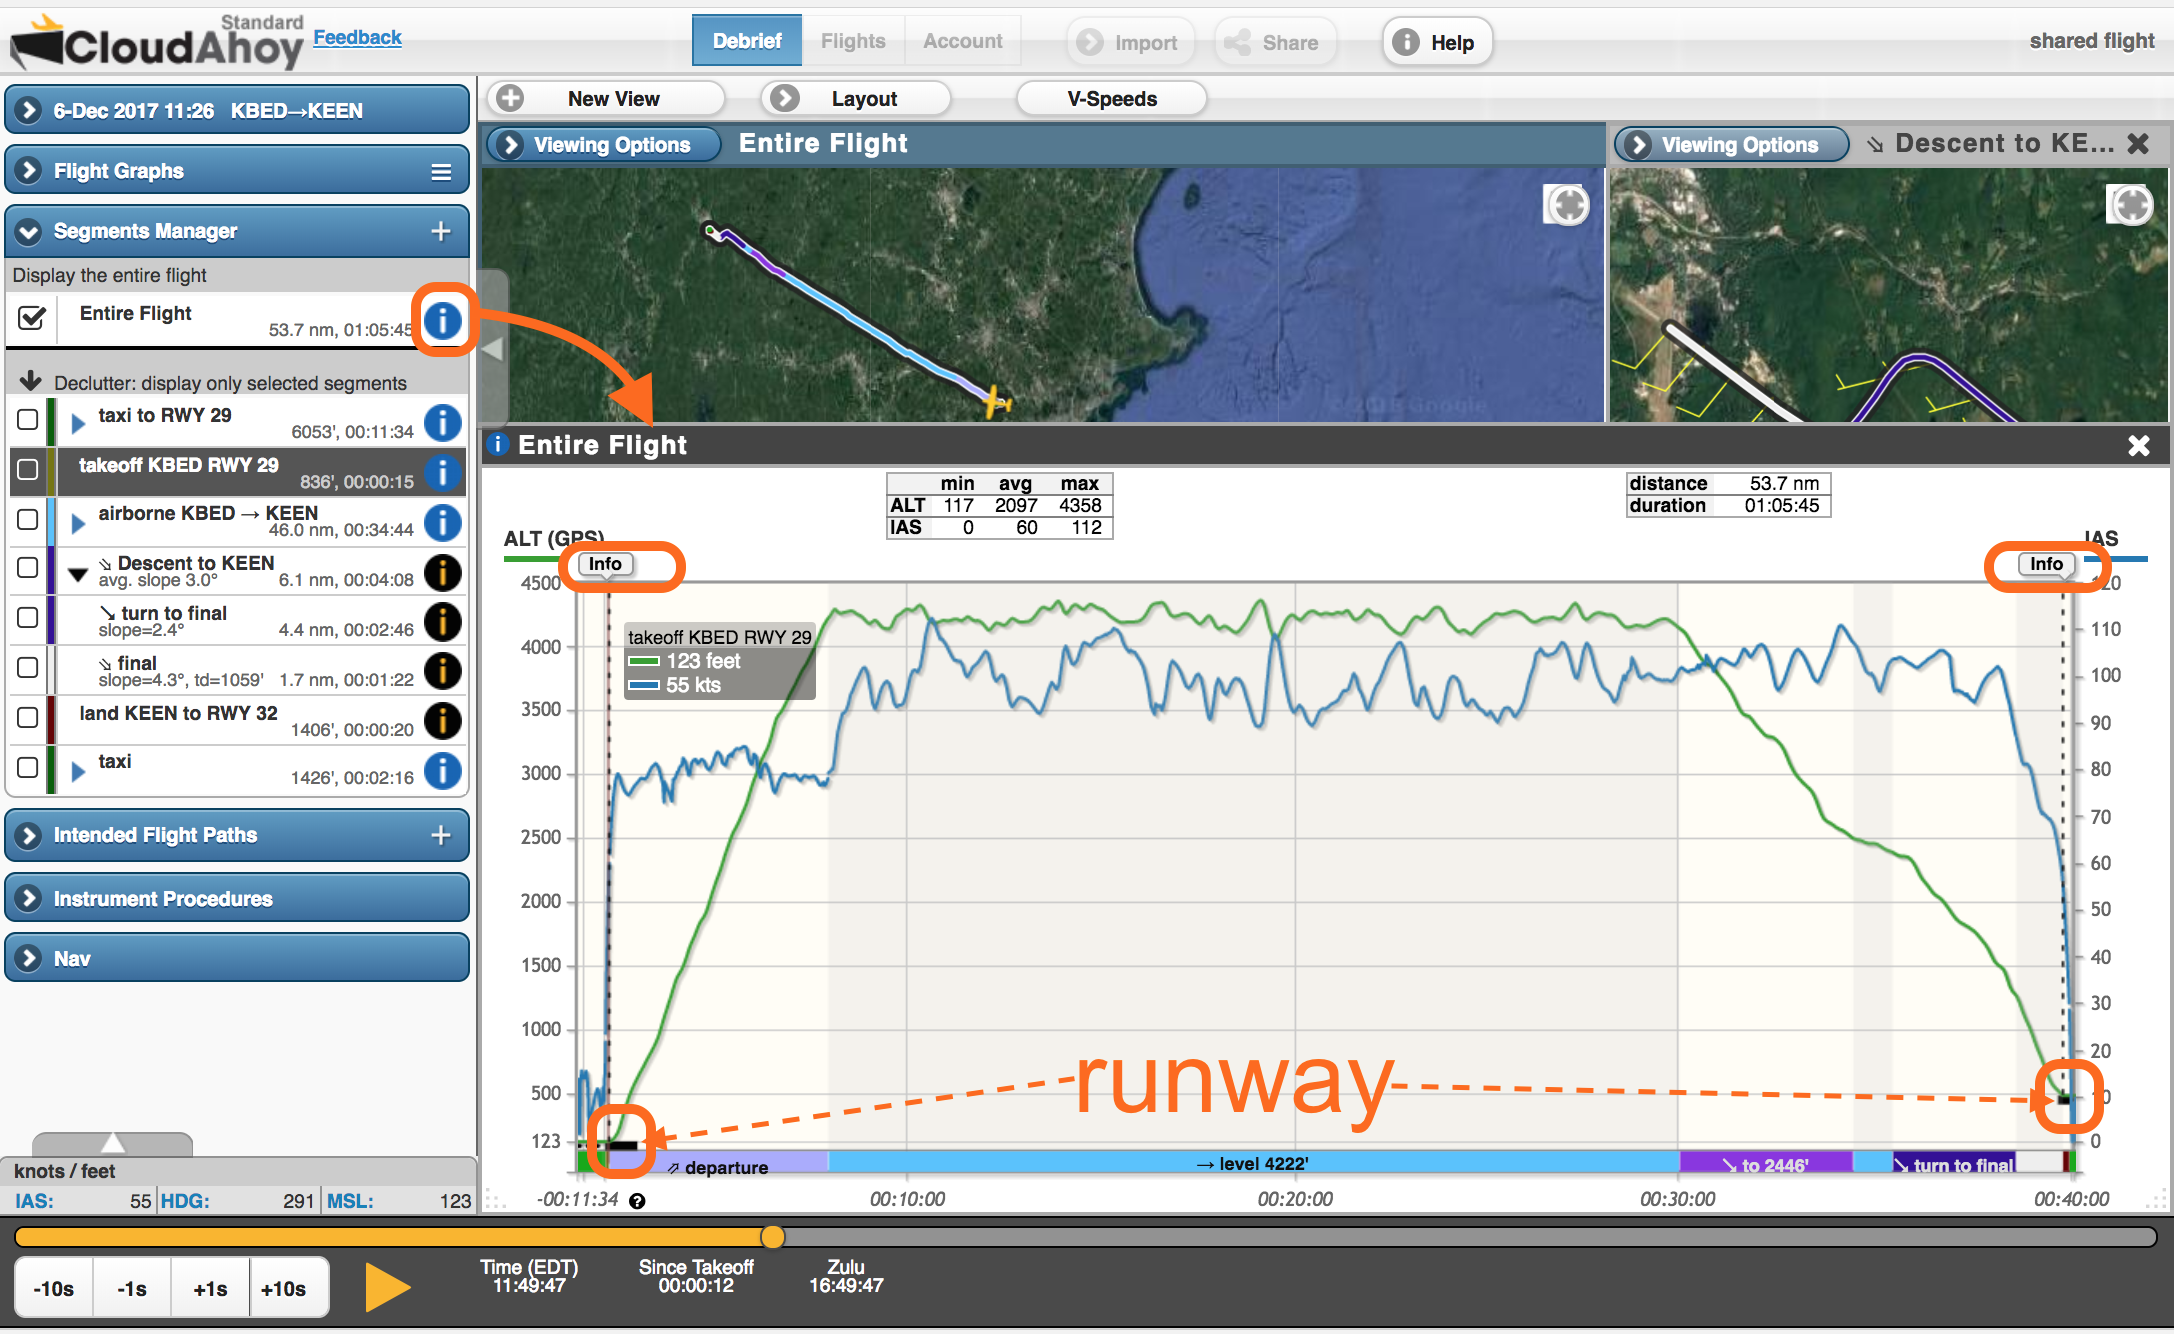
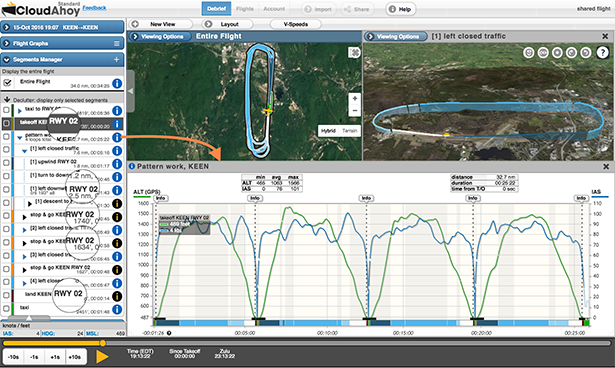
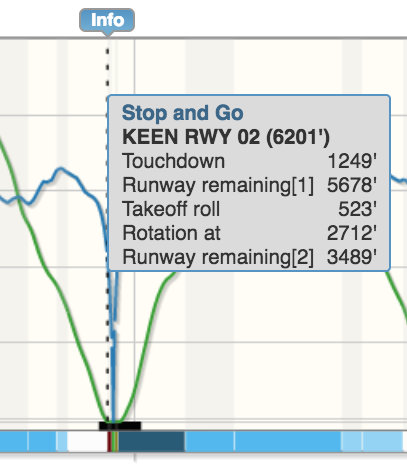
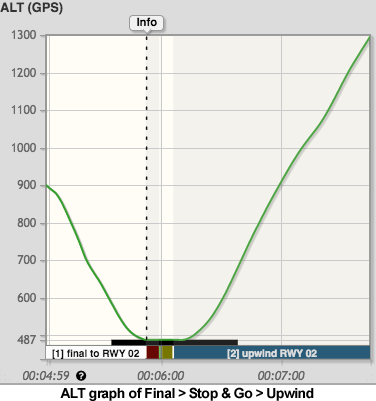
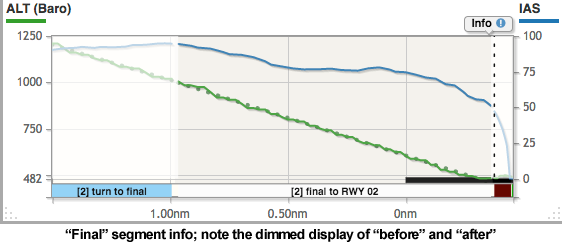
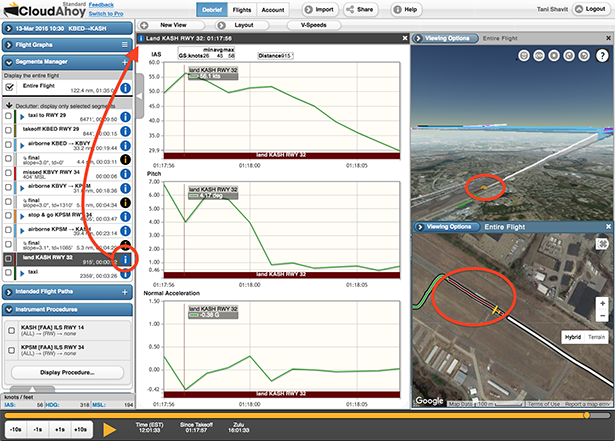
The CFI Assistant leverages the automatic flight segmentation which is part of the core CloudAhoy technology.  It scores individual maneuvers as well as the entire flight. The user interface and visualization enables drilling down and highlighting areas for improvements, using smart graphs and visualization.

“The CFI Assistant is released after more than two years of development.”  says Shavit. “We combed through data from thousands of flights, and received valuable feedback from beta testers in the military, flight schools and individual pilots.”

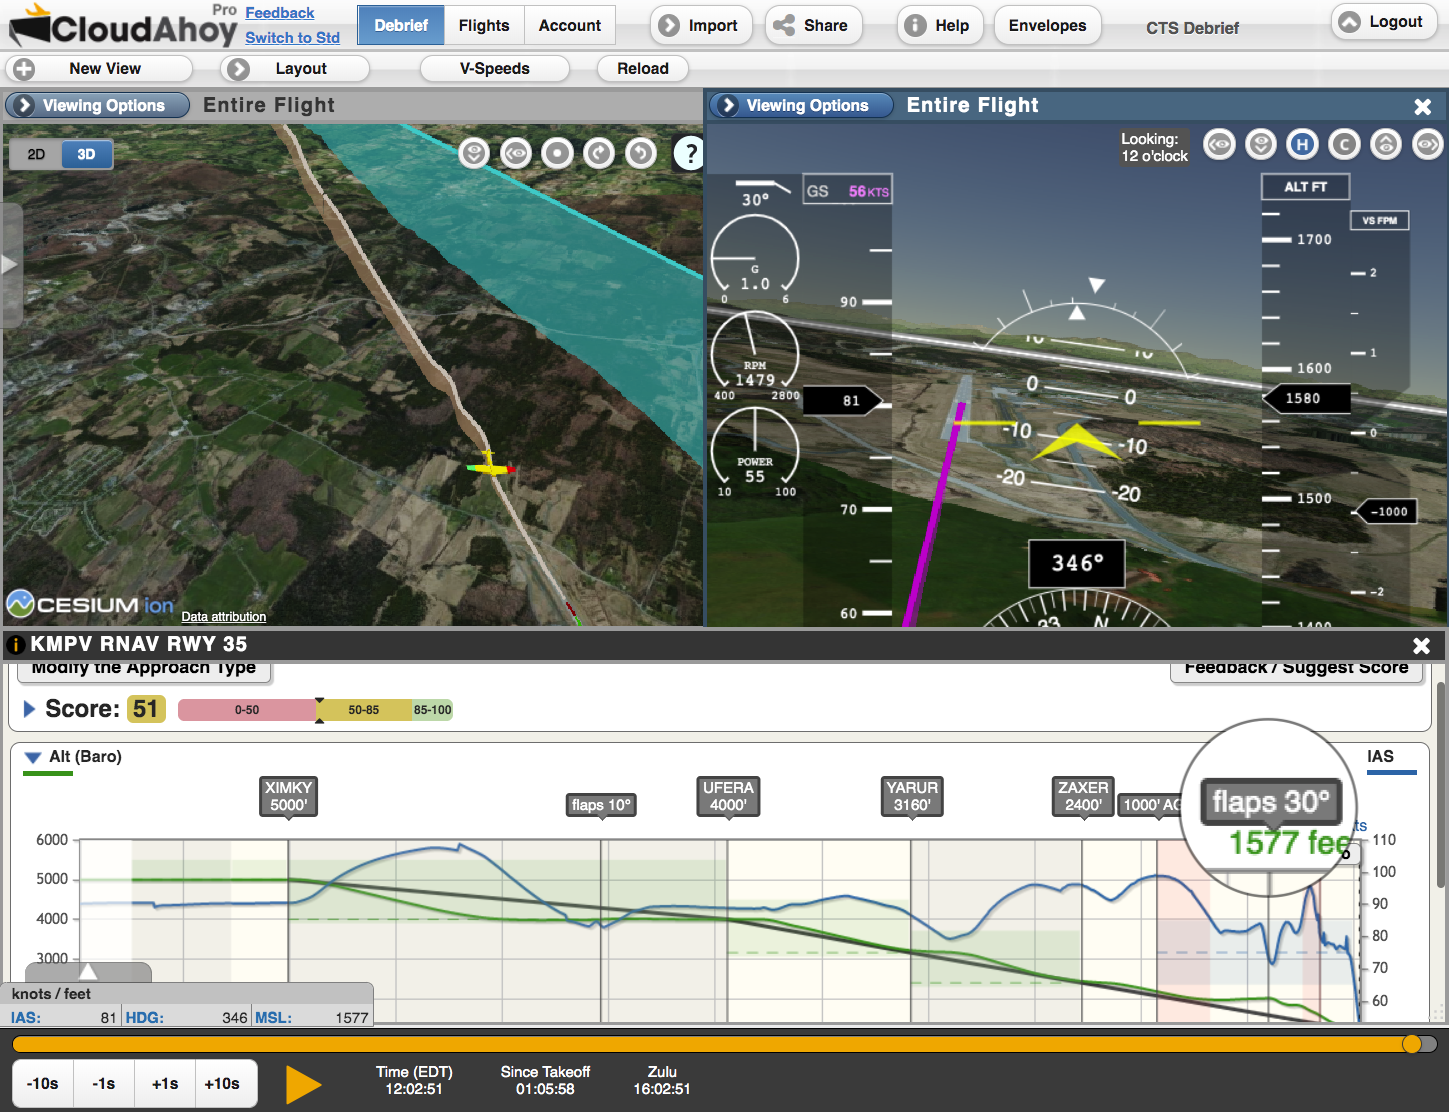
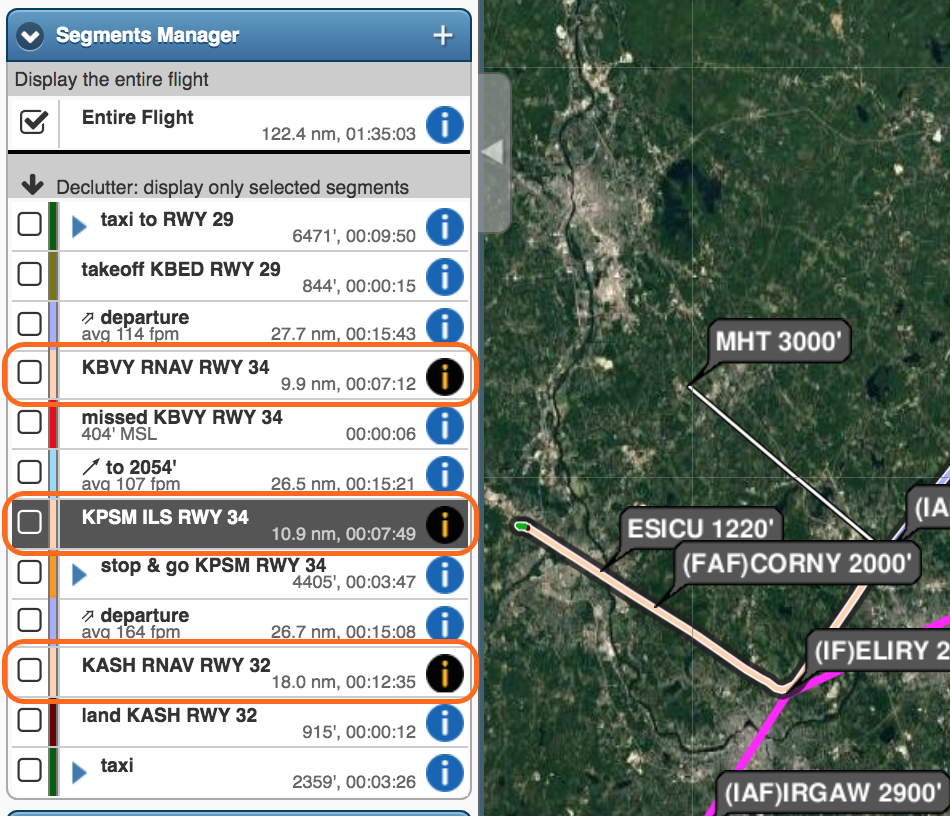
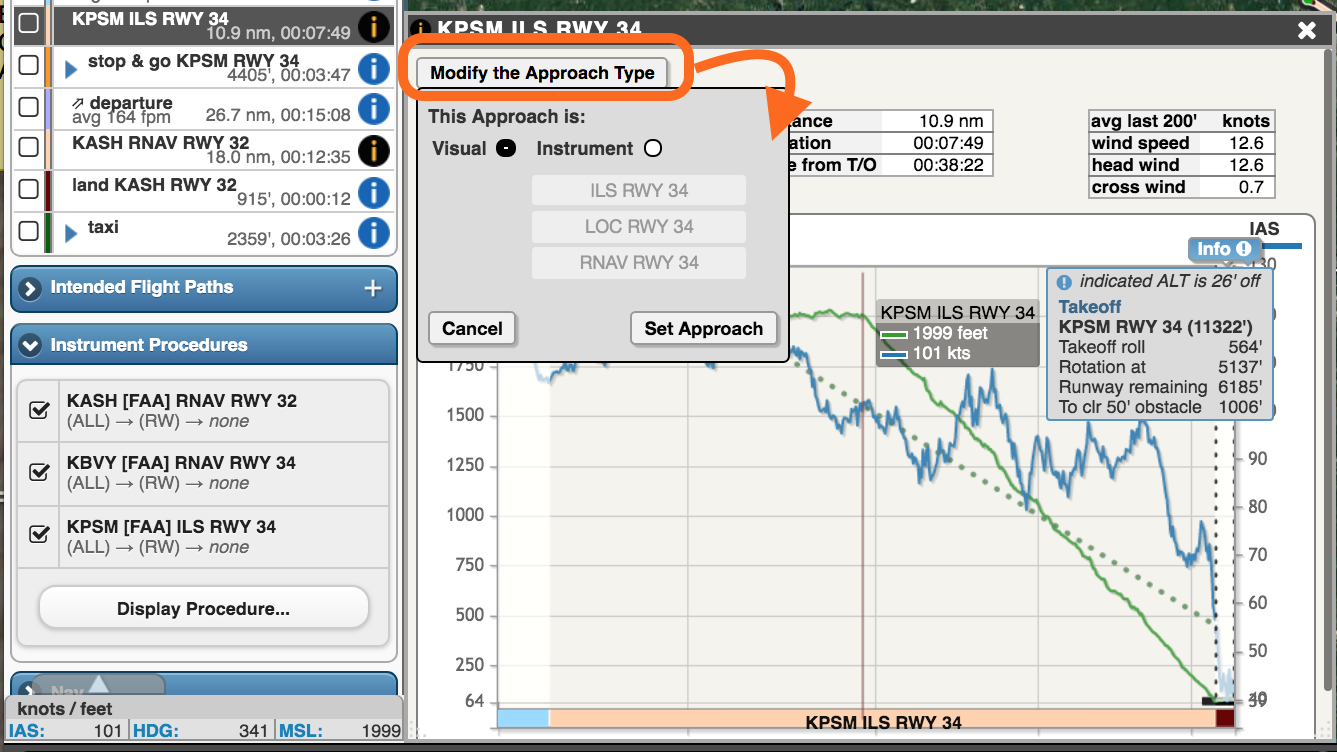
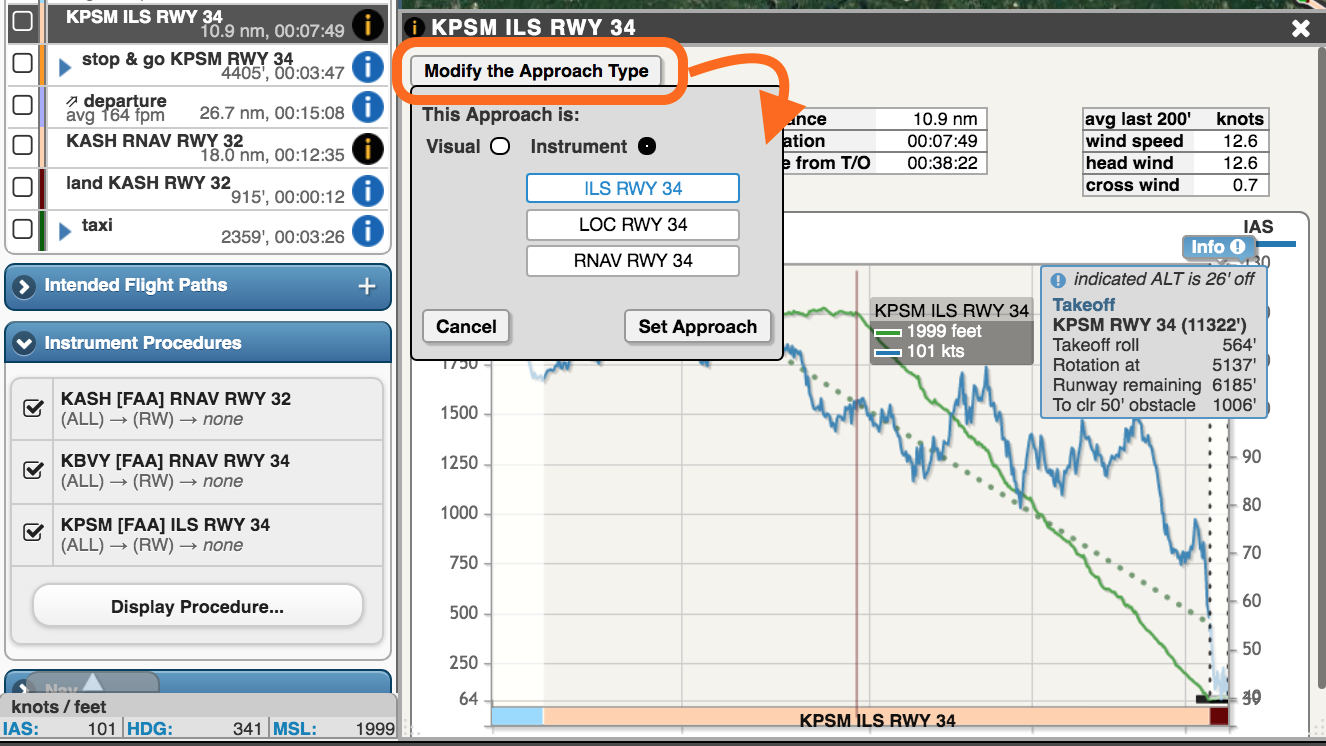
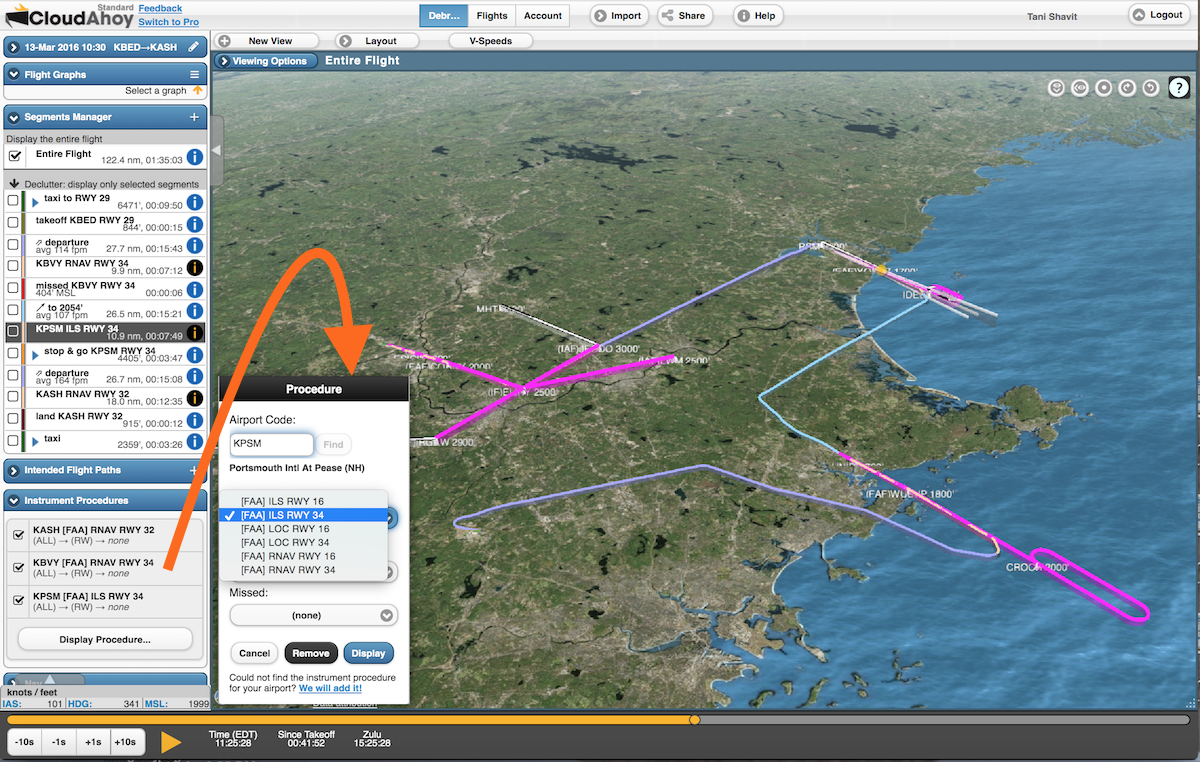
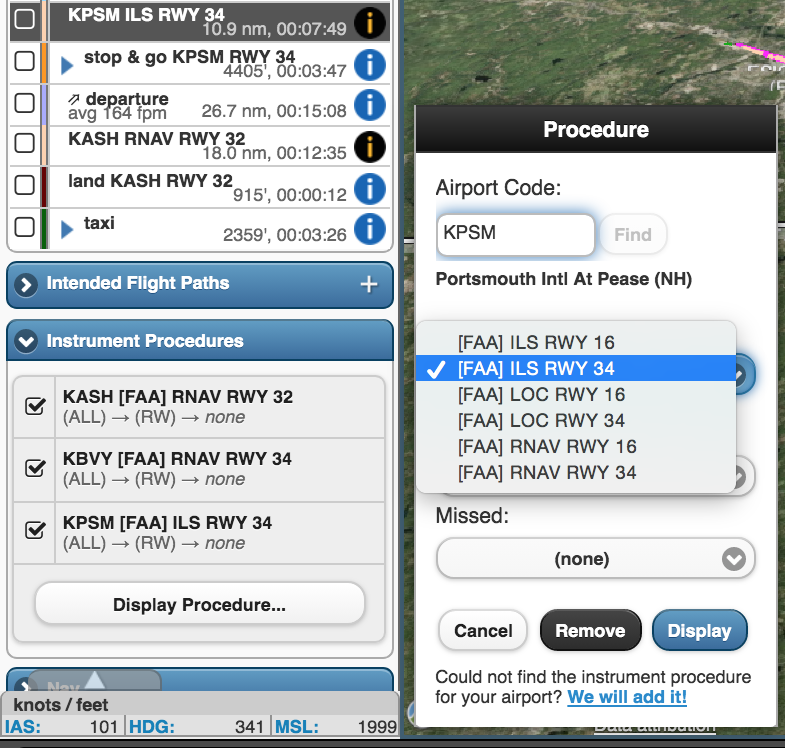
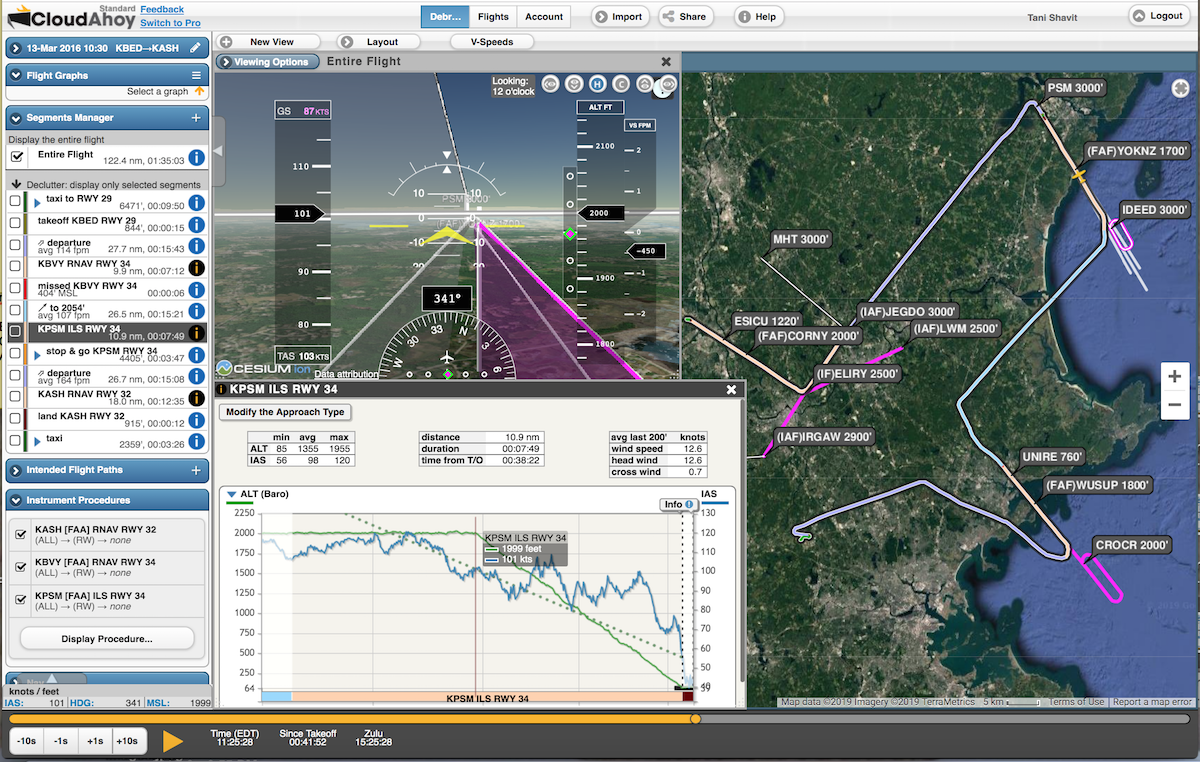
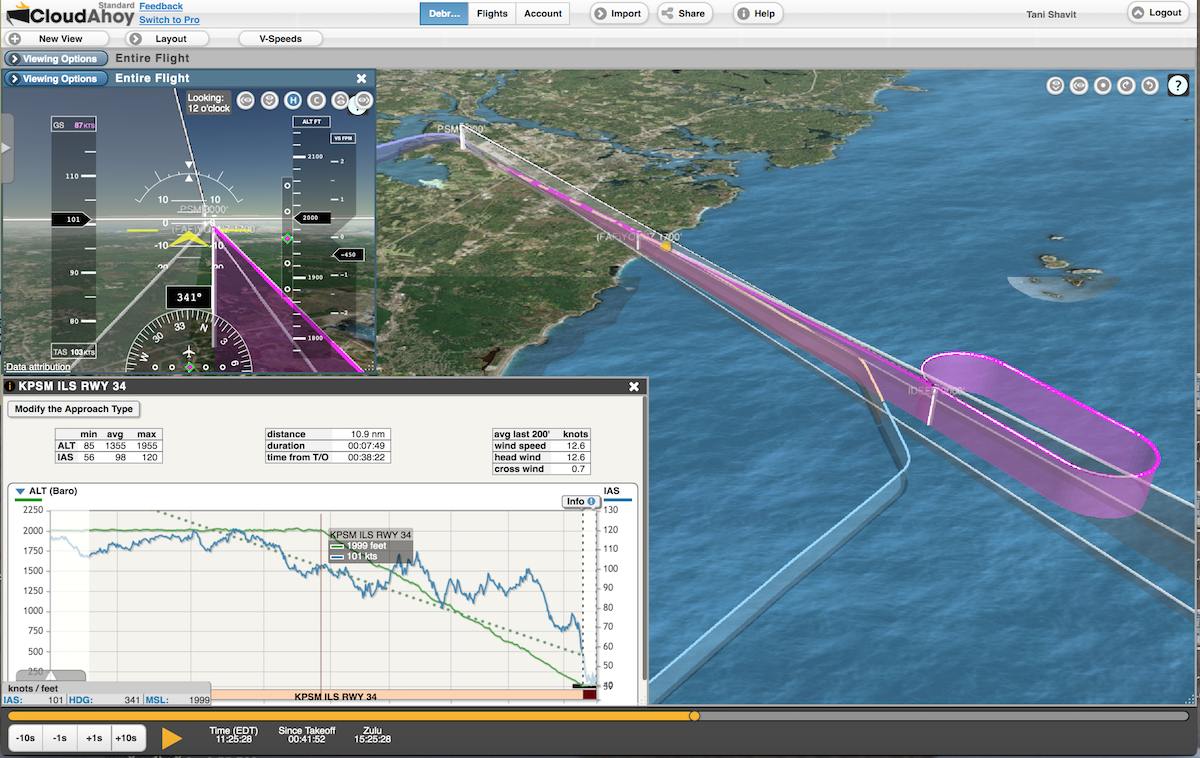
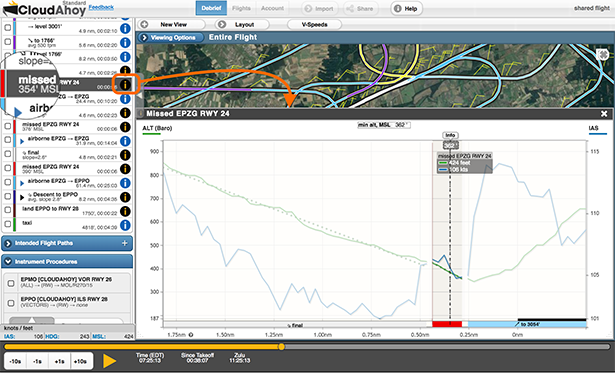
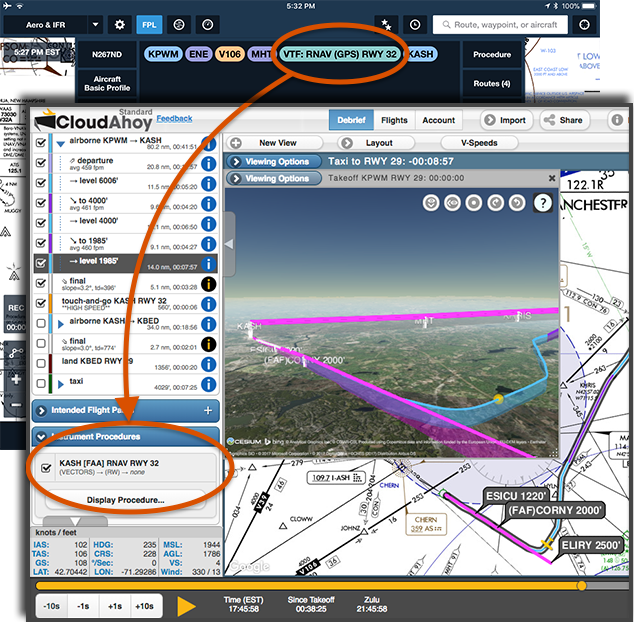
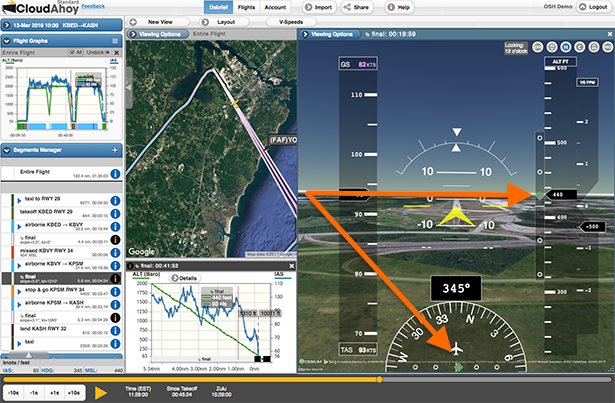
Additional capabilities of CloudAhoy Pro include detailed analysis of instrument approaches, and advanced display of gauges when data is available – such as power settings, G force, flaps, gear, etc.

CloudAhoy 6.0 has many additional improvements, available in both CloudAhoy Standard and CloudAhoy Pro. Those include a redesign of the iPhone interface, predefined layouts, user-friendly segments info and graphs, and other usability improvements. For more accurate analysis, hundreds of aircraft models and their parameters have been added to the aircraft models database.  For organizations such as flight universities and schools, military units, airlines & business operations and alike, CloudAhoy 6.0 includes an organization manager, with subscription management, organization-wide aircraft parameters, and organization-wide customizable scoring envelopes.

CloudAhoy is running a ‘6.0 Special’ until October-23 2019, giving a one-month free subscription of CloudAhoy Pro to every CloudAhoy user, and an extra month for every purchase (12+1).  “We are reaching out to all users, including early adopters of CloudAhoy” says Shavit, “to use the full Pro capabilities.“.  The subscription price of CloudAhoy Pro is $150/yr, the price of CloudAhoy Standard remains unchanged at $65/yr. NAFI and SAFE members have discounted price.

About CloudAhoy
CloudAhoy builds post-flight debriefing products. It integrates flight data with information from a comprehensive suite of aviation resources, analyzes the flight using rule-based knowledge engine, and presents the analysis via detail-rich interactive display.  CloudAhoy brings technology to post-flight debriefing, adding value to any flight training, enhancing the experience of flying, and helps make better pilots. This applies equally to primary, advanced, and recurrent training, and to day-to-day flight operation for self-improvement, and for fun. To learn more please visit www.CloudAhoy.com .

Contact:
CloudAhoy 6.0
Tani Shavit
VP Products & Strategy
(718) 572-5446tani@CloudAhoy.com

###

Image links attached.

Video 6.0 announcement: https://youtu.be/F4wcehDfWjw

More about version 6.0: http://www.cloudahoy.com/cloudahoy6.php

CloudAhoy.com: http://www.cloudahoy.com

NEW: Instrument Approach now Automatically Detected

We released a new version of CloudAhoy with a new feature: automatic detection and display of instrument procedures.

  • The instrument procedures are automatically listed in the Segments Manager in the Debrief tab
  • The published approach overlay is automatically displayed in the Debrief tab
  • The list of instrument approaches is shown in the Flights tab

This feature is available in CloudAhoy Standard.

Here is an example from a practice flight with 3 Instrument Approaches:

CloudAhoy automatically detected the instrument approaches. The detected instrument approaches are displayed on the 2D map in light orange (see also the 3D display below), and in the Segment Manager:

The Segment Manager on the left lists 3 instrument approaches: RNAV, ILS, and another RNAV. The 3 published approaches are visualized (here in 2D, can be also in 3D as shown below).

In the Flights tab, instrument approaches are listed in the “Takeoffs + Approaches, Maneuvers” section:


More analysis info about Instrument Approach – the Segment Info

In the Debrief tab, additional information for each approach is available by clicking the Segment Info icon.

Tip:  approaches are noted by a black icon, while other segments have a blue icon.


In some cases CloudAhoy might identify the approach incorrectly.  This might happen for example when a visual approach is flown straight-in and follows very closely the ILS path, or when the RNAV and ILS are aligned. In such cases, you can provide CloudAhoy with a “hint”, by clicking the “Modify the Approach Type” button.

Example: Modify the approach type from Instrument Approach to Visual Approach.

Example: Modify the approach type from ILS Instrument Approach to another – RNAV or LOC.


Adjust and customize the display of overlays

Note that you can declutter the segments displayed and enable/disable the display of published approaches. You can also display other published approaches. Use the Instrument Approaches section at the bottom of the left panel to make these changes.


More tips: using 3D visualization

Visualizing approaches in 3D is often very informative. In the screenshot below, we opened an additional  ”3D Cockpit” view:


A “3D Track” view is another useful way to view the approach:


New: Runways – visualization and analysis

In debriefing flights, significant attention must be given to runways: the points of rotation and touchdown, the altitude and airspeed during the approach – all are critical to flight safety.

Our latest release includes major enhancements to analysis and visualization related to runways:

  • Displaying the runway(s) on graphs with altitude
    We now display the runway as a thick horizontal line in takeoff operations, as well as in landings, touch & go, stop & go, and missed approaches.
  • Precise information about rotation / touchdown / missed
    We added an info button to graphs. It provides information such as exact touchdown point, runway remaining, and more.


Here are a few examples:

Takeoff and land
A short flight from KBED to KEEN:

In the Segments Manager, we clicked the Segment’s Information icon of the
Entire Flight. Notice the display of both runways at the lower part on the graph, and the corresponding two buttons at the upper part. We can also see that KEEN is at a higher altitude than KBED.

Traffic pattern
The following example is of a night currency flight. We clicked the Segment Information  icon of the Pattern Work segment. It shows the same runway multiple times. The green graph shows the altitude. Note how the blue graph (IAS) drops to 0 at each stop & go.


With one click or tap on one of the  buttons, you get precise information about the runway operation of the selected Stop & Go.


Another way to display the data is by decluttering. The ALT graph on the right shows three consecutive segments: Final, Stop & Go, and Upwind.

It is easy to see where on the runway were the touchdown and rotation points.


Missed Approach
The missed approach is shown with the “before” and “after” segments (dimmed.). The runway is displayed on the lower-right.

This is a graph of a precision instrument approach. Note the ALT trajectory (green graph) of the Final – if continued, it would intersect the runway at the 1000′ mark.

Display and usability: viewing Segment Information  in context
We now display every Segment Information  view in context, with dimmed “before” and “after” as in the image above, of the missed approach.

Another example, of a “Final” segment information:


Landing – Segment Info improved

The “land” segment (created by CloudAhoy’s auto segmentation) is short in time but crucially important for evaluating the quality of the landing, especially in cases of incident investigation.

In our latest release we improved the Segment Info of the “land” segment (working with a customer who was investigation an incident – thank you!).

The Segment Info of the “land” segment is especially valuable if the flight was logged with an EFIS, for example imported from Garmin G1000, because the data includes Pitch and Normal Acceleration data (G) – in addition to the IAS which is always available with CloudAhoy.

A story told in three graphs
The screenshot below is of C172 flight imported from Garmin G1000. By clicking the  icon on the “land” segment, we get three graphs of the landing segment: IAS (top graph), Pitch, and Normal Acceleration (bottom). Note the brown landing segment in the 2D view (bottom right). The graphs tell a story:


  • The graphs’ crosshair indicates the exact time of touchdown, when the G was at a minimum.
  • The magnitude of the G graph at touchdown indicates an acceptable landing: neither a “greaser” nor a hard landing.
  • The plane touched down at 5-6° pitch; only the two main wheels touched the ground.
  • After the initial touchdown, the pitch gradually decreased to 0° in about 4 seconds. Note the G graph when the pitch reached 0°: it shows the nose wheel touching the ground, and doing it softly.
  • Zooming on the 2D view, the pilot touched down and remained on the centerline.

The information is especially valuable for analyzing hard landings and porpoising:

  • In hard landings, you will see a sharp spike in the Normal Acceleration (G) graph.
  • In porpoising, you will see fluctuations in the pitch attitude, as well as positive and negative spikes in the Normal Acceleration. The minima indicate touchdowns, and the maxima mark the top of the bounce.

If Normal Acceleration and Pitch are not available, we display only the IAS graph.

Debrief instrument approaches flown with ForeFlight

New: when you import a flight from ForeFlight, CloudAhoy will now automatically display the instrument approach flown, if any.

In addition to the instrument approach, CloudAhoy already imported from ForeFlight the entire flight plan. Both are now shown in magenta.

Note that you can always manually add additional instrument approaches.

The picture above shows an example of IFR flight: KPWM > KASH > KBED

Flight planning:
– The pilot was using ForeFlight and entered the IFR flight plan KPWM > KASH.

In the cockpit:
– ATC assigned RNAV (GPS) RWY 32 at KASH, with vectors to final. The pilot added the procedure.

After landing:
– the pilot imported the flight to CloudAhoy.
– When debriefing the flight for the first time, the RNAV approach is automatically shown in CloudAhoy as well as the entire flight plan, both are shown in magenta.


CDI display in cockpit view

If you import your flights from Garmin G1000, your can now view the horizontal and vertical CDIs on CloudAhoy’s glass cockpit gauges. It is useful for debriefing the accuracy of your navigation, and specifically your flying of instrument approaches.

The screenshot below shows the short final of an ILS approach. The horizontal CDI is centered (i.e., the aircraft is on the runway’s extended center line), and the vertical CDI shows the aircraft above the glide slope.

Note that if you fly a non-precision approach, then the vertical CDI will not be displayed. Also, the horizontal and vertical CDIs are not displayed when there is more than full-scale deflection.