In debriefing flights, significant attention must be given to runways: the points of rotation and touchdown, the altitude and airspeed during the approach – all are critical to flight safety.
Our latest release includes major enhancements to analysis and visualization related to runways:
- Displaying the runway(s) on graphs with altitude
We now display the runway as a thick horizontal line in takeoff operations, as well as in landings, touch & go, stop & go, and missed approaches. - Precise information about rotation / touchdown / missed
We added an info button to graphs. It provides information such as exact touchdown point, runway remaining, and more.
Here are a few examples:
Takeoff and land
A short flight from KBED to KEEN:
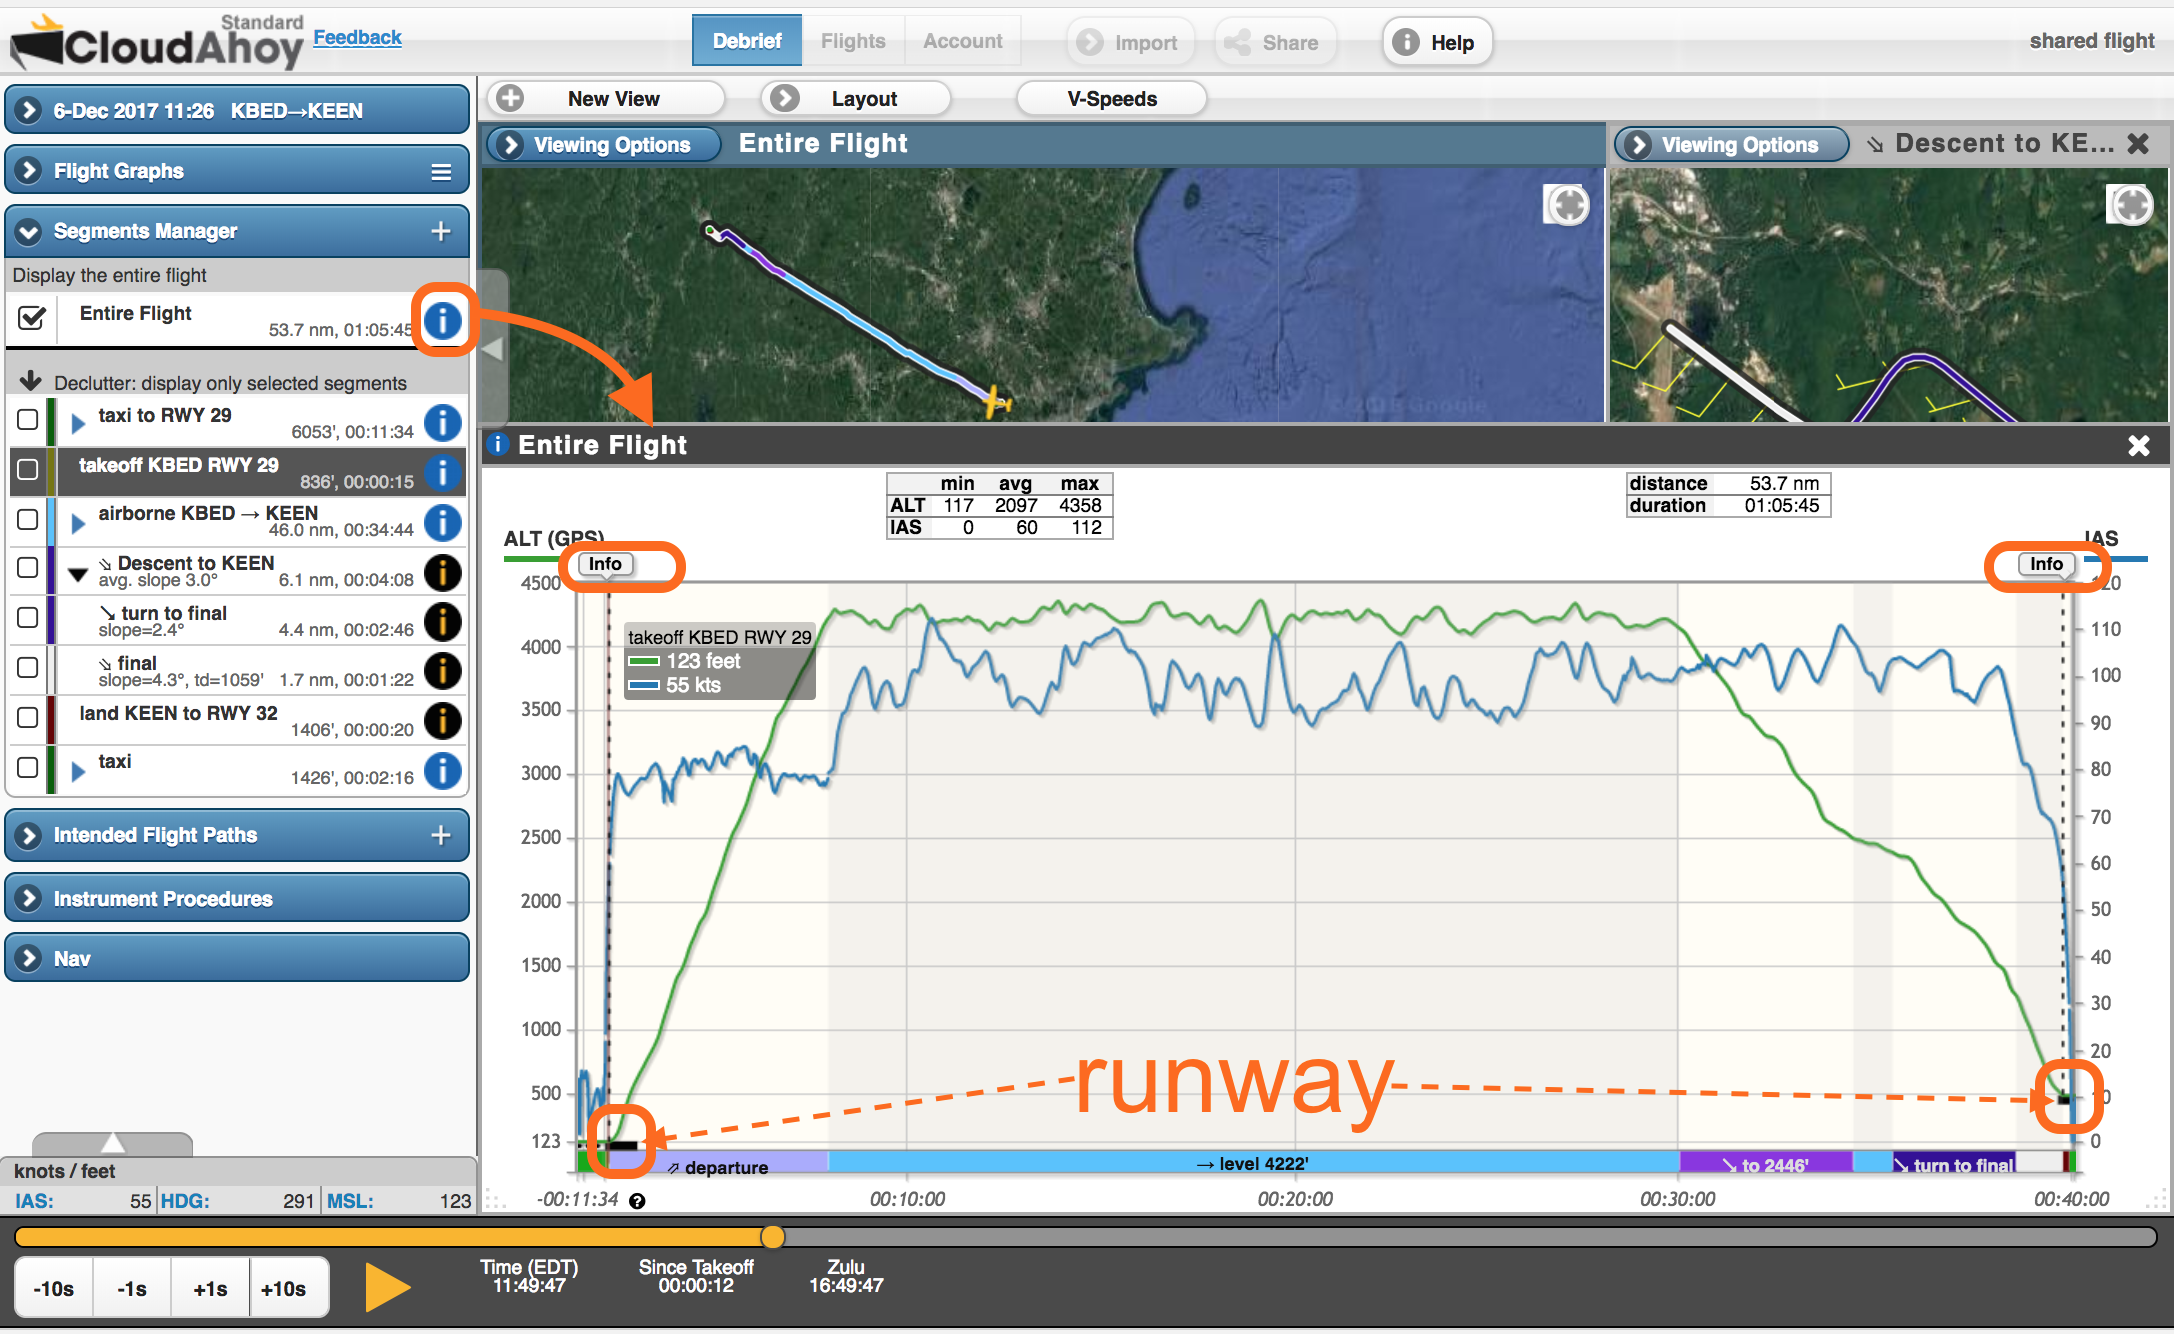
In the Segments Manager, we clicked the Segment’s Information ![]() icon of the
icon of the
Entire Flight. Notice the display of both runways at the lower part on the graph, and the corresponding two ![]() buttons at the upper part. We can also see that KEEN is at a higher altitude than KBED.
buttons at the upper part. We can also see that KEEN is at a higher altitude than KBED.
Traffic pattern
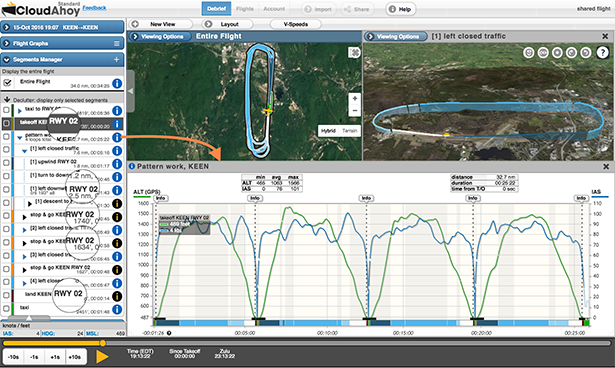
The following example is of a night currency flight. We clicked the Segment Information ![]() icon of the Pattern Work segment. It shows the same runway multiple times. The green graph shows the altitude. Note how the blue graph (IAS) drops to 0 at each stop & go.
icon of the Pattern Work segment. It shows the same runway multiple times. The green graph shows the altitude. Note how the blue graph (IAS) drops to 0 at each stop & go.
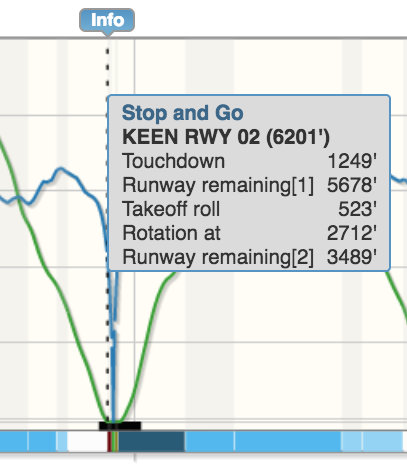
With one click or tap on one of the ![]() buttons, you get precise information about the runway operation of the selected Stop & Go.
buttons, you get precise information about the runway operation of the selected Stop & Go.
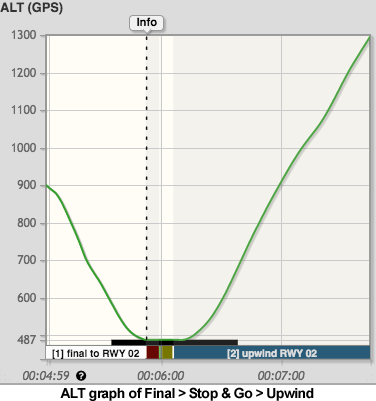
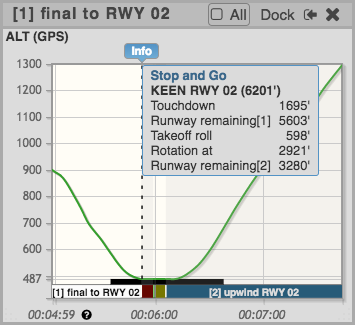
Another way to display the data is by decluttering. The ALT graph on the right shows three consecutive segments: Final, Stop & Go, and Upwind.
It is easy to see where on the runway were the touchdown and rotation points.
Missed Approach
The missed approach is shown with the “before” and “after” segments (dimmed.). The runway is displayed on the lower-right.
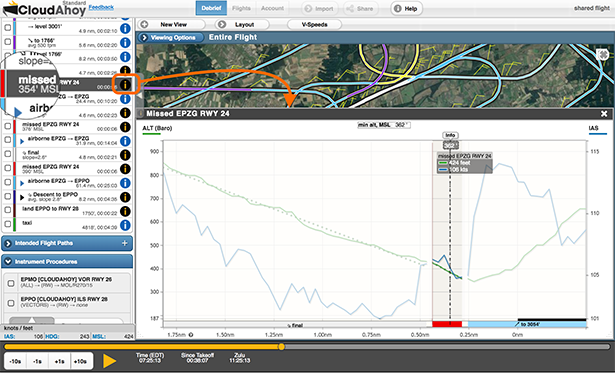
This is a graph of a precision instrument approach. Note the ALT trajectory (green graph) of the Final – if continued, it would intersect the runway at the 1000′ mark.
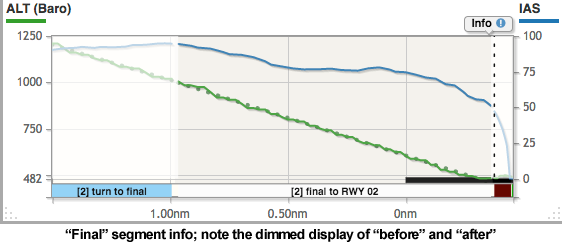
Display and usability: viewing Segment Information in context
We now display every Segment Information ![]() view in context, with dimmed “before” and “after” as in the image above, of the missed approach.
view in context, with dimmed “before” and “after” as in the image above, of the missed approach.
Another example, of a “Final” segment information:
This is great!
I agree!
make picture 3 a default layout!!! please…