Our new release of CloudAhoy enables you to specify your fixed-wing plane’s V-speeds.
The main benefit of doing so is for aircraft with “unusual” characteristics, such as vintage aircraft, “one-offs”, very fast planes, etc. In those cases you can enter the V-speeds, and CloudAhoy analysis will be more accurate.
Example
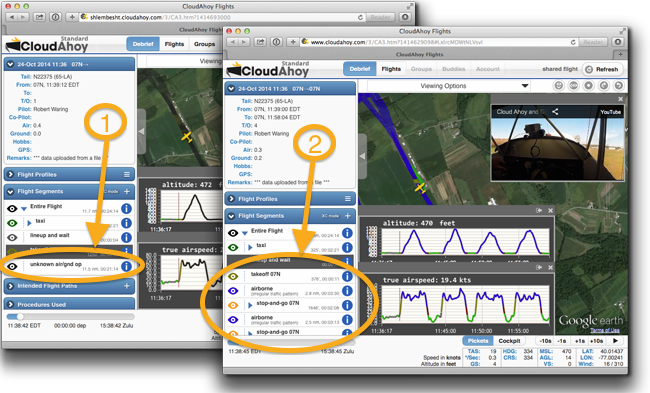
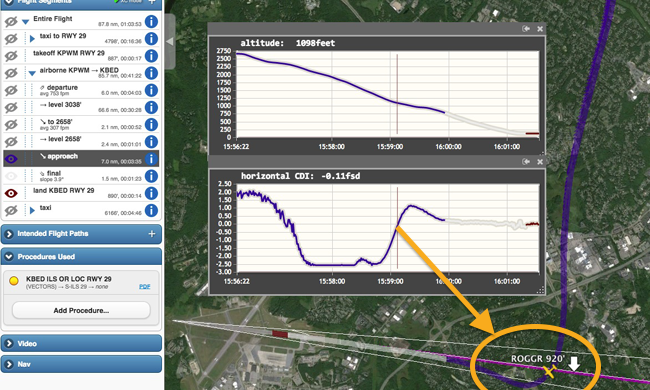
Last week Rob Waring was flying four traffic patterns in his 1939 Aeronca Chief, a relatively slow tail dragger. Not knowing the plane’s V-speeds, CloudAhoy calculated them, over-estimated Vs (stall speed) by 10 knots, and labeled most of the flight as an “unknown flight op” since parts of it were below stall speed – see 1 below. By specifying the Aeronca Chief’s V-speeds, CloudAhoy provided Rob with an accurate analysis – see 2 below.
I had a lot of fun debriefing Rob’s flight, since he had embedded in it a nice cockpit video. If you have a few minutes, click this, turn on the audio, and enjoy 🙂
Background: V-speeds and CloudAhoy
For safe flying, every pilot of a fixed-wing aircraft needs to know the plane’s V-speeds. Likewise, to analyze and evaluate the flight, CloudAhoy needs to know the V-speeds.
Until now, CloudAhoy estimated the V-speeds automatically from the flight envelop. This works well most of the time, but there are end-cases, such as very slow or very fast planes, in which CloudAhoy’s estimates might be off. The new feature enables you to increase CloudAhoy’s accuracy by explicitly providing the V-speeds.
“System” V-speeds
CloudAhoy has a “system” V-speed defined for several common aircraft types. If you fly a US or a Canadian aircraft, CloudAhoy will look up the tail number in the registry, determine the type and apply the “system” V-speeds if known rather than estimate the V-speeds. Over time CloudAhoy will have system V-speeds defined for more and more aircrafts types. 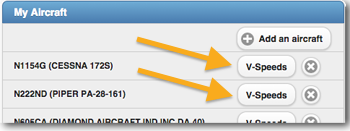
How to enter the V-speeds
You can enter your plane’s V-speeds in the “My Aircraft” section of the Account tab. The example below shows how a user is overriding Vr.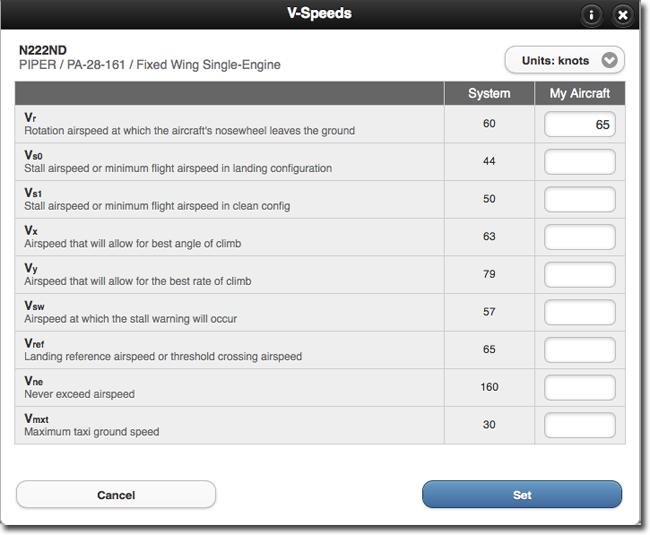
Should you enter V-speed numbers?
In most cases, you don’t need to enter V-speeds – although it never hurts.
If you don’t enter V-speed numbers, CloudAhoy will typically analyze your flights correctly by either estimating the V-speeds, or by using the “system” V-speeds for your aircraft type.
There are two cases in which CloudAhoy’s analysis will benefit from your entering the V-speeds:
- There are no “system” V-speeds available for your make/type aircraft, and it seems that CloudAhoy has made some errors in analyzing the flight – for example, it incorrectly labeled a section of the flight as “stall”.
- There are “system” V-speeds for your make/type aircraft, but they do not reflect the numbers which you use. For example, you may prefer to rotate 5 knots above the aircraft’s “system” Vr. Or perhaps your specific aircraft has some modifications which lower the normal Vso
You can override any of the “system” V-speeds. Note that entering V-speeds affects only the analysis of your flights. It does not affect other pilots, even if they fly the same identical plane.
Let us know about your V-Speeds
If your plane type does not have a “system” V-speeds and you have entered standard V-speeds for it, please send us an email (dev@cloudahoy.com). It would help other pilots flying the same make/type.
As always, we welcome your feedback.
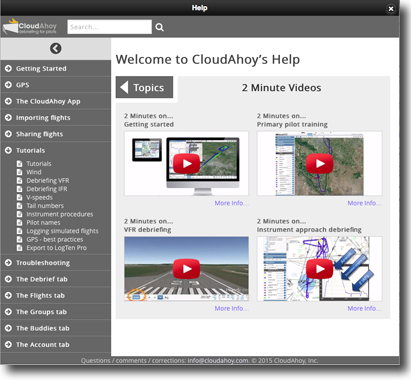 You will find tips for an effective VFR and IFR flight debriefing, tips for using your GPS, information about importing flights from ForeFlight or from Garmin G1000, and much more.
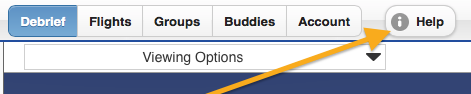 Invoking the help from CloudAhoy (app and web): click the Help button located right of the tab list.
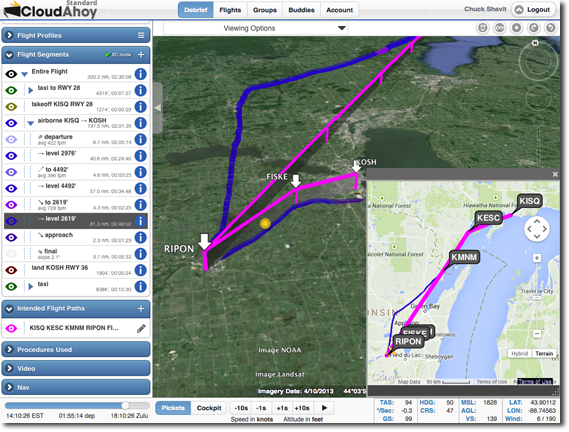
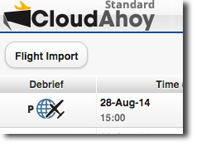 Click the Flight Import button. Enter the flight’s pilot names, tail number and optional remarks (you can edit all these later), select the CSV file with the data, then click Import.
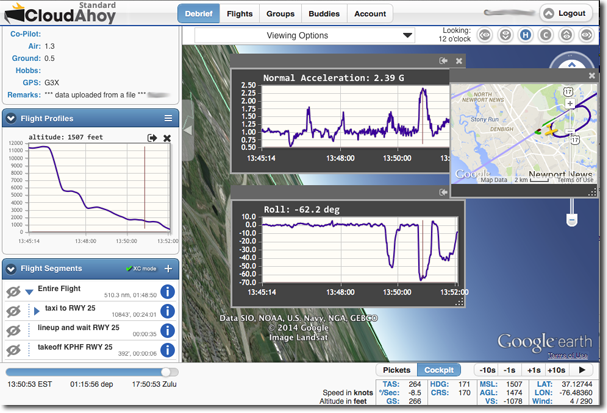
 uick reminder: